Momentum, in the confines of the Technical Analysis is the rate of change in the price of a security. It also refers to the change in its volume. As both the price and the volume cannot accelerate in one direction continuously, momentum is used as an oscillator.
As time progresses, both the change in price or volume is inclined to decline and regrow. What this means is that when the price is in an uptrend, the momentum is inclined to the positive. Should it be in the downtrend, then it is negative.
The Momentum Calculation
More often than not, within charting platforms, the momentum indicator is done with consideration to its price. However, some developers opt to design momentum indicators when looking at volume.
For the sake of this discussion, we will hold the definition of momentum as the change in a N-period simple moving average (SMA) within a specific duration.
For this, refer to the formula below:
Momentum = SMA(now) – SMA(N-periods ago)
What this means is that the longer the period, the indicator will look smoother.
For a clearer picture of this, refer to the chart below:
Fig. 1
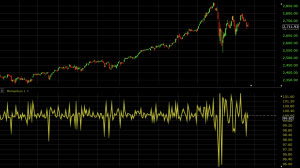
Fig. 2
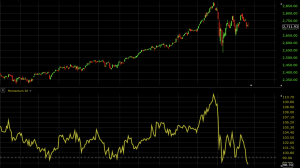
Should the Momentum Indicator be used on the S&P 500’s chart, we will be seeing a 1-period Momentum Indicator (Fig. 1) within the entirety of the map which is relative to a 50-period. (Fig 2)
In its reading, do note that the indicator is often set to 100 as baseline. Should you find it above 100, there is a rate of change on net, and will be seen as rising. If it were below the 100, then the rate of change is decreasing within a specific duration.
The Momentum Indicator
Once a momentum reaches an extreme level, it is seen as unsustainable. It is also used as an indication of a price reversal. Using indicators alone will not render any fruitful trading decisions. If one is to make use of it to search for price reversals, then it should go hand-in-hand with 1-2 more indicators for close-to-accurate readings.
Should the indicator be applied to assets that are highly speculative like digital currencies, then it is highly likely that it won’t work just as well. This is the case as there are varying opinions about these assets valuations.
Assets of such nature are capable of creating price bubbles or unpredictable trading behaviour.
Complicating things further, traders and investors are also polarized on how to use Momentum. Momentum trading follows the direction or the trend of the momentum. Simply put, it capitalizes on the trader’s inclinations. It may also re-rate in the valuation of an asset in light of a motivator. A short-term strategy, it does away with Fundamental Analysis.
The Momentum approach veers away from the “buy low and sell high” template. Instead, it employs either the “buy high and sell higher” or “sell low and sell lower” methods. Some analysts concur that that one would be able to make money out of securities when they’re moving really fast.
Momentum Strategy # 1: Price Reversal
As already stated earlier, the momentum indicator must be paired with another one so that it would become effective. What this means is that it would be complementary, thus turning out more statistically-accurate readings.
Let us take for example the Kelter Channels. The tool uses the touch of the top and bottom bands in search of areas that could see reversals.
When the tandem of tools promotes price reversal signals at the same time, it would be sound to take a trade in the intended direction.
Momentum Strategy # 2: Breakout Strategy
For this Momentum strategy, the high momentum levels are followed instead of a stretched indicator that reads as a signal for a price reversal. As this is the case, there is a need to set up a new set of indicators. Keeping things simple, moving averages may be used. They will gain value should they be in shorter length. Suffice it to say, Momentum trading uses a short-term timeframe.
The takeaway from this Momentum strategy is that high change rates in price don’t endure. As this is the case, it would do you well to get it as soon as possible.

The Gist of It
Momentum, referred to as the change in the price of securities in a specified duration, acts as an oscillator. The Momentum Indicator is best for indicating price reversals. For the indicator to work more efficiently, in that it will render statistically accurate signals, then it has to work with another indicator.