How to recognize a Japanese candle a hammer and an inverted hammer? How they differ from a hung and shooting star? Peculiarities of trading on hammer candles (hammer).
The most common and easiest to interpret the figure of candlestick analysis is the Hammer Candlestick pattern (Hammer). The model consists of only one candle, but it gives fairly accurate signals, so almost all experienced traders take into account its appearance on the chart.
It is easy to spot the bullish candlestick pattern, which consists of one candlestick, which reverses the trend upward and is very similar in appearance to a hammer.
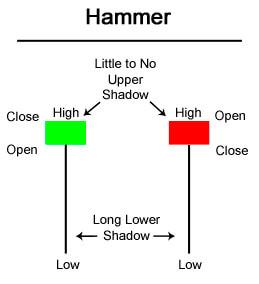
Hammer Candlestick pattern (English hammer) – a figure on the chart of Japanese candles, consisting of only one candle. The characteristic features of the Hammer are that this candle has a long lower shadow and a short body, i.e., graphically resembles a hammer. Hence, it is very easy to notice on the chart. You can also read the article Top 5 best candlestick patterns you should know.
What is the “Hammer” figure in simple words and its types
Visually, this candle resembles a Hammer Candlestick pattern hanging on the clamps with the handle down: the lower shadow is the handle, the body is the shocking part, the upper shadow is the end of the handle protruding from the shocking part.
The hammer figure may appear on the graph inverted – in the form of a hammer hanging upwards with the handle and down with the shocking part.
An “inverted hammer” arises exactly under the same conditions as a normal one and gives identical (oddly enough) signals as the hammer (candlestick pattern). The hammer candle and its types appear exclusively in a downtrend. The pattern can be formed both by growing (with a body of light color) and lowering (with a body of dark color) candles.
With intraday and short-term trading, the light color of the Hammer Candlestick pattern gives a stronger signal.
When conducting long-term trading, the body color of the hammer-hammer does not matter.

How to trade by candlestick hammer and inverted hammer
As already noted, the Hammer pattern in candlestick analysis is a bullish candlestick pattern buy signal.
If this candlestick chart pattern appears on the price chart, the trader should consider opening a long position. Before making a deal, it is recommended to check the pattern signal for reliability. For example, the MACD indicator also gave a buy signal; after the figure, a large light candle with a long lower shadow formed, intraday prices have a widespread.
The following criteria can estimate the strength and reliability of the signals of the Hammer Candlestick pattern:
- A light-colored candle (growing candle) has greater power than a dark (lowering) candle;
- The candle touched/crossed the support line on the chart, while the candle closed above the level of this line;
- The large size of the body of a light hammer candle (the more, the better);
- The smallest body size of a dark hammer-candle (up to the formation of a Doji cross);
- The length of the upper shadow of the candle – the shorter, the better (in the ideal Hammer model, the upper shadow is completely absent);
- The length of the lower shadow of the figure – the longer, the better (however, the significant length of the candle, also, in this case, can indicate extreme market instability).
You should not open a long position when the “Hammer” figure appears, if bearish figures (for example, “Closing Maribose”) were formed directly in front of it, or if a hammer candle with a dark body crosses the support level, closing under it.